Open Source Adoption Funnel Stages
Scarf analyzes how companies interact with your open-source project to infer their progress toward adopting it. Funnel Stages represent the portion of the user journey that best describes any given company or lead, from the moment they learn of your project, to when they deploy it to production, and beyond.
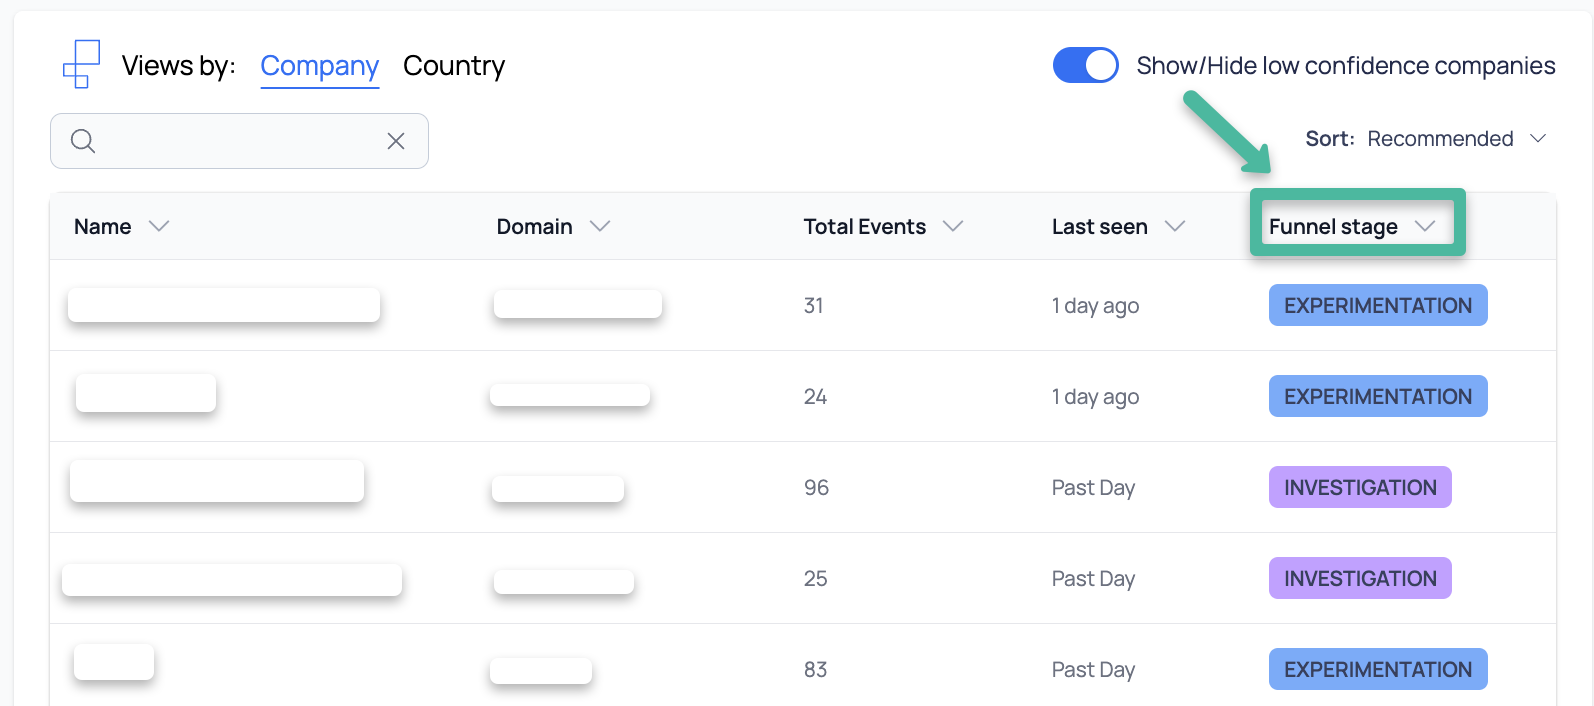
All paid subscribers and active trial participants will see a Funnel Stage on Company Views/Downloads in your Package and Pixel Analytics. Funnel Stages begin at the most basic level with interest, increasing all the way to ongoing usage.
As events by a user/organization occur, such as views or downloads, Scarf assigns point values to them. Those points add up over time as a user moves into different stages of the funnel. The frequency of activity is also considered, and points can be removed as the time between activities increases and the perceived interest or likelihood to adopt decreases.
Scarf’s funnel stages are as follows:
Interest
A company enters this stage following initial events such as viewing your documentation, README, or site (pixel activity only - a download would trigger the investigation stage).
Investigation
Enough activity has occurred for us to suspect the user/organization is actively investigating your OSS. This stage includes the occurrence of multiple events such as at least one package download with multiple docs views or at least two weeks of consecutive pixel view activity, and the company has been active in the last 30 days.
Experimentation
Sufficient activity has occurred for us to suspect the company is actively trying your OSS, but might not be relying on it in a production workload yet. Events such as multiple downloads and page views will have occurred over 30 days, or a single download and multiple page views over 60 days. The origanization may be in the development with your OSS, or prototyping, or running internal tests. We don't yet have enough evidence to make stronger conclusions about production usage.
Ongoing Usage
By this stage, Scarf has enough data to conclude the company is using your software in an ongoing manner, potentially in a production environment. Companies in this stage may be ready to become paying customers and should be moved into your sales/marketing pipeline where available. For non-commercial open-source projects, companies in this stage may be good sponsorship targets or valuable advocates in the community. These companies will have event activity over the course of the past 90 days, such as continued downloads or views.
Inactive
Companies may move into an inactive stage when activity drops off and does not resume over 60 or more days. If activity resumes, the company will return to the last active stage.
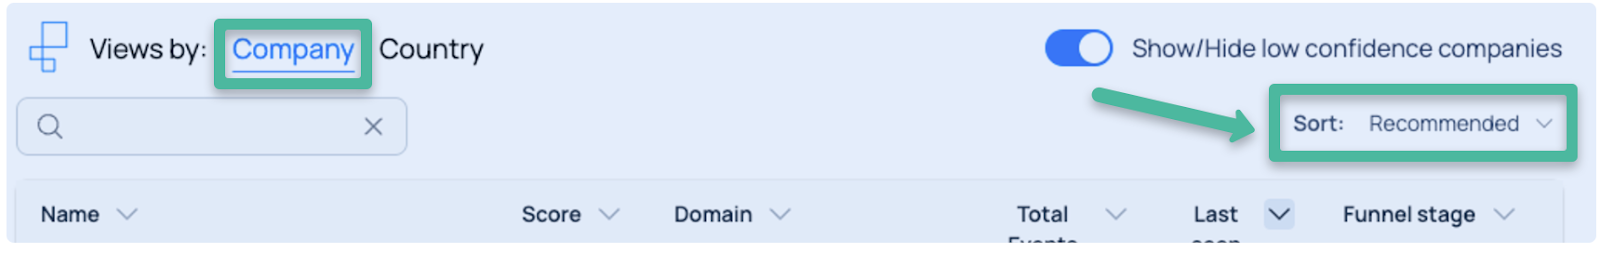
Recommended Sort
The Recommended Sort reorders the list of companies in the activity table in descending order, first by their point value, then by number of events, and finally by most recent to oldest last seen value. This sort option lets you view the companies most worthy of your attention first.
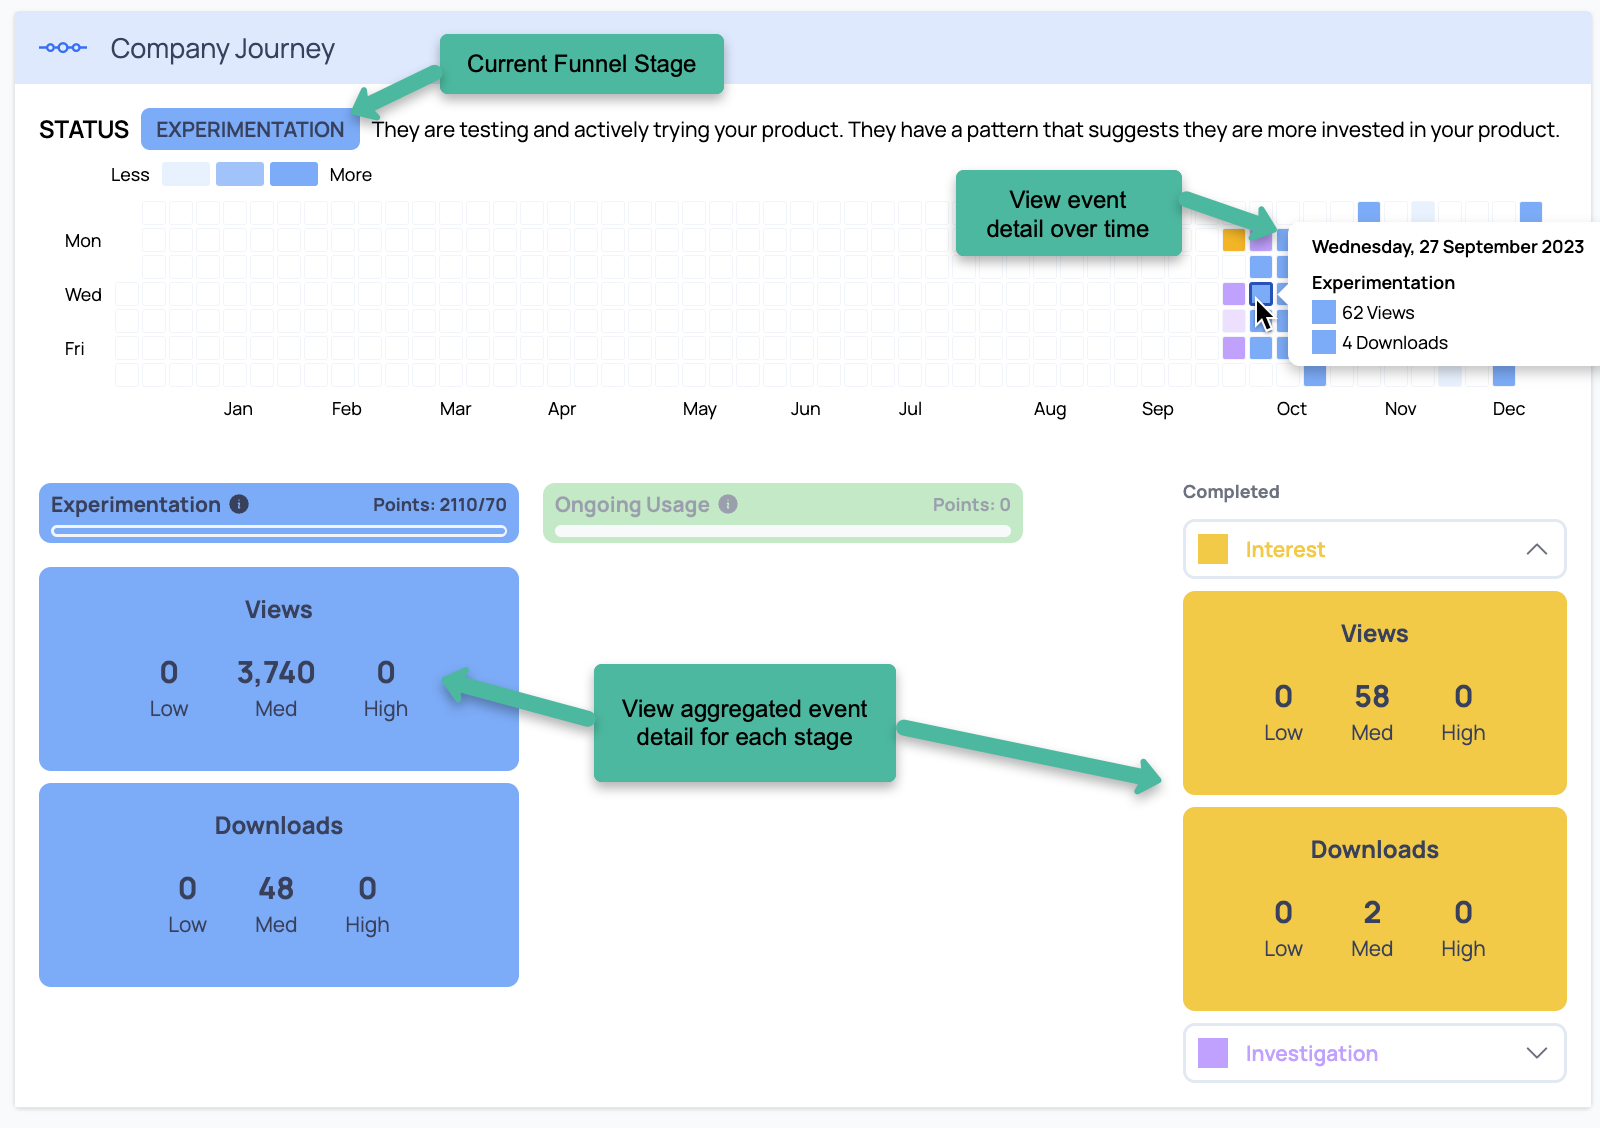
Company Journey
When selecting a company to view in greater detail from any of the Company analytics charts, Administrators will see greater detail within the Company Journey. The company’s current funnel stage will be displayed in the top left, next to STATUS. Hover over the graphical calendar in the Company Journey to see details of the views and downloads that occurred over time. Below the graphical calendar are aggregated views of the total activity within each stage, including the current stage.
Event Importance
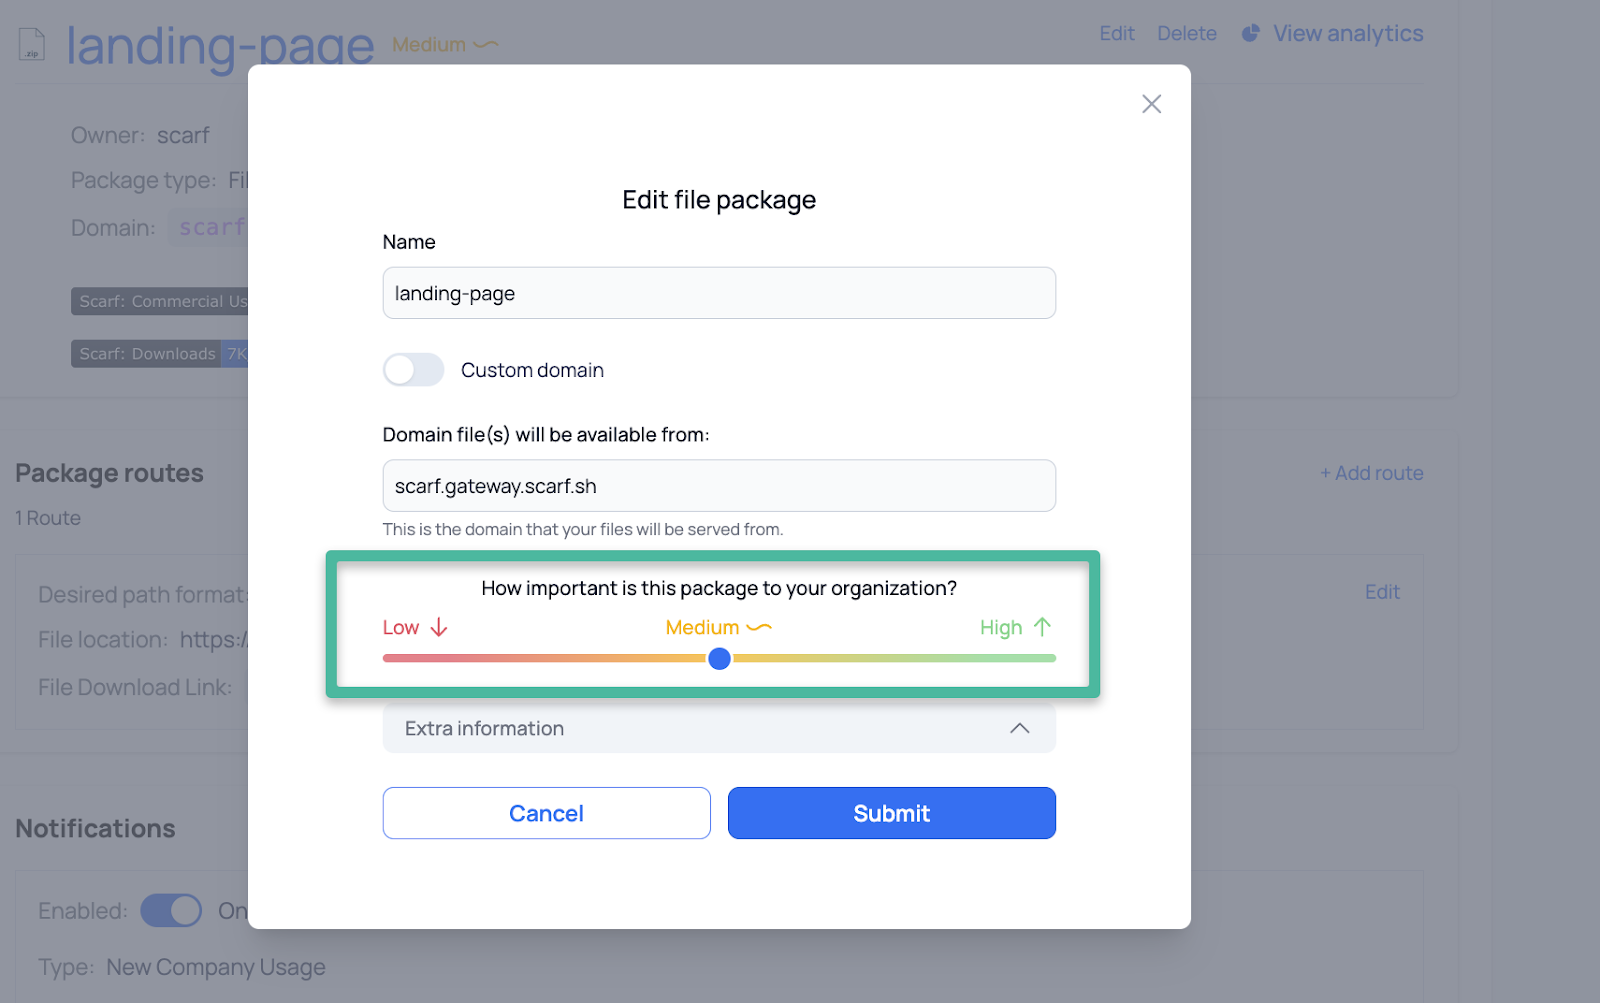
Event Importance allows you to determine the weight that certain events carry over others. For instance, a download should carry more weight than a page view on your public website as it shows higher interest. This importance can be defined when setting up a new pixel or package and can be edited anytime. The importance will default to medium.
You’ll see the Event Importance noted on the Events detail charts.
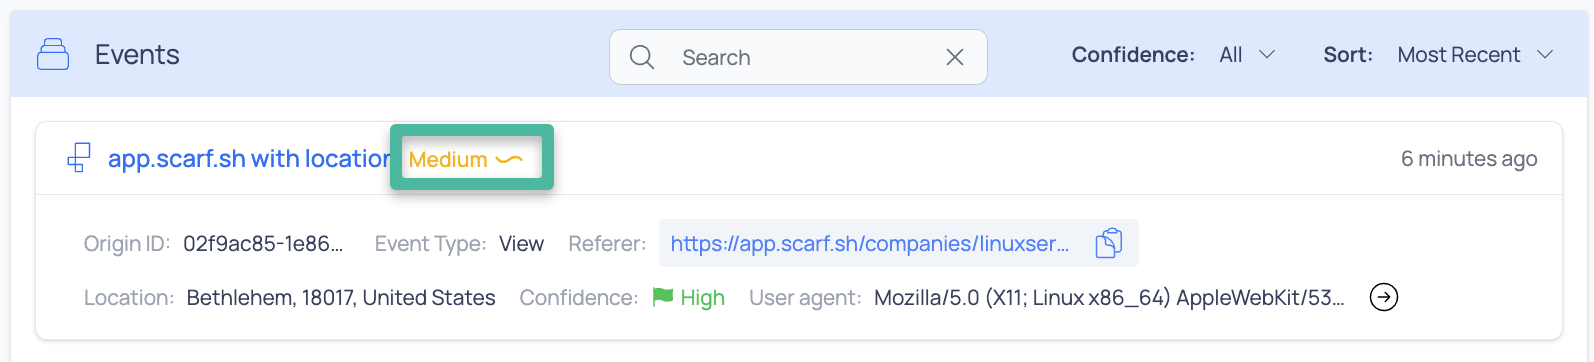
Use the Event Importance slider to set or edit the importance of a Package or Pixel.
Using Your Scarf Funnel Stage Data
Scarf's data combines lead scoring's best features with intent data. Real-time activity highlights the companies actively researching and testing your open-source software. This data facilitates operationalizing the usage and intent data provided by your Scarf Gateway. Utilize the data to track trends in usage over time to indicate your ideal customer profile, highlight opportunities and risks, such as early indicators of potential churn, or documentation that needs more frequent updating.
Sudden and/or unexpected changes in activity levels or types may indicate a company looking to make a change. While this change may be good or bad, it is worthy of attention and investigation. Key examples include:
-
A previously consistent user goes inactive
-
An existing paying customer of yours becomes very active with OSS, potentially indicating a downgrade before it actually happens
-
You begin to see more traffic to documents explaining data export by certain users
Go Even Further with Your Outreach
If you’re interested in going beyond the company-level data that Scarf provides in our OQLs and Funnel Stages, Scarf can help you procure a list of individuals with contact information that may be good target leads at your target companies. If interested, please contact Scarf Support to discuss our Lead Generation services.